Apex LSP Error in VS Code: Quick Diagnosis and Fixes
Urgent guide to diagnosing and fixing the Apex LSP error in VS Code. Learn the root causes, practical quick fixes, and step-by-step repairs to get your Salesforce development back on track.

The Apex Language Server Protocol (LSP) error in VS Code usually means the language server failed to start or crashed, often due to a misconfigured Salesforce DX project, missing dependencies, or connectivity issues when loading metadata. Try restarting VS Code, reinstalling Salesforce extensions, ensuring Java is installed, updating Salesforce CLI, and verifying your workspace settings.
What the Apex LSP error means in VS Code
The Apex Language Server Protocol (LSP) error in VS Code signals that the language server powering Apex code intelligence either failed to initialize or crashed during use. This server provides autocomplete, error highlighting, and navigation for Salesforce Apex, so when it falters, your coding flow is disrupted. According to Why Error Code, this kind of failure is often tied to tooling mismatches and environmental prerequisites rather than the codebase itself. Understanding that the error is a failure of the tooling, not your syntax, helps you triage quickly and avoid needless debugging of your Apex classes. By diagnosing the problem at the source—extensions, runtime, or project configuration—you can restore smooth development in record time.
In practice, you’ll often see messages like "Apex LSP server has crashed" or the language features stall with a spinning indicator. This is a signal to check the setup around the language server, not just the code you’re writing. With the right steps, you can bring the language server back online and resume productive work without hours of frustration.
Symptoms and signals you'll notice
The Apex LSP error manifests through a combed set of symptoms that point to where the fault lies. You may see VS Code notifications stating that the Apex LSP server cannot start, frequent timeouts on intellisense, or persistent red error squiggles in your Apex files. Logs in the OUTPUT panel under "Apex LSP" or the Developer Console in VS Code can reveal connection failures, file path mismatches, or missing dependencies. Tasks such as compiling, retrieving metadata, or running test classes may fail abruptly during development. You might also notice extensions briefly showing as disabled or an incorrect workspace configuration causing the server to fail to attach to your project. These signs collectively guide you toward the root cause rather than random debugging. It’s common to encounter these symptoms after an update or when switching between Salesforce DX projects.
If you’re troubleshooting under time pressure, focus on the most visible indicators: startup failures, broken intellisense, and the presence of clear error messages in the Apex LSP output. These clues will narrow down whether the issue is environmental, extension-related, or project-specific, enabling targeted remediation.
Common causes by likelihood and how to prioritize fixes
Why Error Code analysis shows that the most frequent culprits behind Apex LSP errors are environment-related rather than code-related. The top causes typically include missing prerequisites like Java, a corrupted or misconfigured Salesforce extension, and issues with the Salesforce DX project setup. Medium-likelihood issues involve network restrictions or proxies that block metadata loading, while low-likelihood problems include rare bugs in the language server itself or conflicting VS Code plugins. Start with the most actionable items: verify prerequisites (Java and Salesforce CLI), then repair the extension installation, and finally confirm your project configuration. By addressing the highest-lidelity causes first, you reduce the total repair time and avoid chasing elusive edge cases. A systematic approach will also minimize repeated crashes and restore reliable LSP behavior across your Salesforce development environment.
- Likelihood: high for extension issues and Java configuration
- Likelihood: medium for DX project setup and network constraints
- Likelihood: low for random language-server bugs
Pro tip: keep a separate, clean Salesforce DX project handy to test whether the issue is project-specific or global to your VS Code setup.
Quick fixes you can try right now (no tools required)
If you’re in a rush, these quick fixes can often restore functionality without a deep dive. First, restart VS Code and use Command Palette to Reload Window. Then, update or reinstall the Salesforce extensions, ensuring you install the official Salesforce CLI hooks if prompted. Verify Java is installed and added to your PATH, and confirm JAVA_HOME is set correctly. Open a new terminal inside VS Code and run sfdx --version to ensure Salesforce DX is accessible. If nothing changes, sign out and back into Salesforce DX in your workspace, or clone a fresh copy of your Salesforce project to rule out workspace corruption. Finally, check for any pending VS Code updates and apply them, as bug fixes can include LSP stability improvements. These steps are designed to be low-effort but high-impact, often resolving the majority of startup and startup-related LSP failures.
Notes: avoid disabling security features or proxies unless you understand the network implications, and always back up your project before performing significant config changes.
Deeper repairs: Step-by-step fixes for persistent failures
When quick fixes fail, a deeper, methodical repair sequence is required. Begin by validating the environment: confirm the correct Java version is installed (as required by your Salesforce tooling version), verify the JAVA_HOME path, and ensure no multiple Java runtimes conflict with the LSP. Reinstall the Apex-related VS Code extensions, including any dependencies, and clear VS Code’s extension cache if available. Next, ensure the Salesforce DX project structure is intact: retrieve the project’s metadata, re-authenticate with your Salesforce org, and ensure sfdx plugins are up to date. If a proxy or firewall is present, configure VS Code to use the system proxy or whitelist Salesforce endpoints. Finally, test with a minimal, clean project to determine if the issue is project-specific. Documenting the exact error string, timestamp, and steps already tried will help if you need to escalate to support. Each repair step reduces the scope of potential causes and helps isolate the root problem more efficiently.
Environment and configuration checks for long-term stability
Environmental mismatches are a leading cause of Apex LSP instability. Confirm you’re on a compatible VS Code version and that the Salesforce extensions match your Salesforce DX project’s requirements. Check your workspace settings for any custom LSP configurations that may override defaults and disable essential features. Validate that your system meets the recommended memory and CPU requirements for running VS Code with large Salesforce projects. Review your terminal output for network or authentication warnings and ensure that your Salesforce credentials are valid. Consider enabling verbose logs for the Apex LSP extension to capture richer diagnostic data. Finally, ensure your development environment is consistent across teammates to avoid “works on my machine” issues.
By maintaining a clean, consistent environment and documenting changes, you reduce recurrence of Apex LSP errors and improve overall developer productivity.
Edge cases and when to seek professional help
In rare scenarios, persistent Apex LSP errors may indicate deeper issues with the Salesforce tooling stack or a regional outage affecting metadata services. If you’ve exhausted all local remedies, collect a comprehensive diagnostic bundle: VS Code version, Apex LSP version, Salesforce CLI version, Java version, exact error messages, and a minimal reproduction project. Submit this bundle to trusted support channels or a professional consultant who specializes in Salesforce development tooling. While most issues resolve with the steps above, specialized environments or enterprise configurations can require hands-on attention. The goal is to restore a stable baseline and prevent regressions moving forward.
Steps
Estimated time: 45-75 minutes
- 1
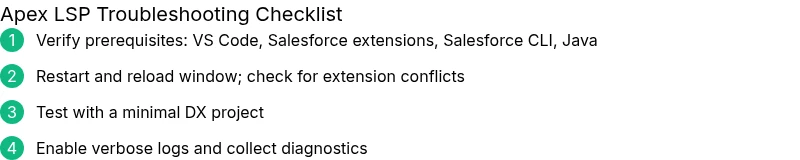
Verify prerequisites
Confirm you have a compatible VS Code version, the official Salesforce extensions, and a working Salesforce DX setup. Run a quick check of versions and path variables to rule out basic misconfigurations.
Tip: Document current versions to compare after each fix. - 2
Reset and reload the Apex language server
Use the Command Palette to reload VS Code, and if the problem persists, disable/reenable the Apex extension or temporarily disable other extensions to isolate conflicts.
Tip: A clean restart often clears transient server hiccups. - 3
Reinstall extensions and CLI
Uninstall the Apex-related VS Code extension package, reinstall it, and run sfdx --version to ensure the CLI is available. Re-authenticate if necessary.
Tip: Always prefer the latest stable release for reliability. - 4
Validate Java installation
Ensure Java is installed (preferably a supported LTS version) and that JAVA_HOME points to the correct JRE/JDK. Update PATH if needed.
Tip: Mismatch between system Java and required runtime can crash the LSP. - 5
Test with a minimal project
Create a small, clean Salesforce DX project and verify the Apex LSP loads; if it does, compare settings with your main project to spot discrepancies.
Tip: A minimal repro helps pinpoint config gaps. - 6
Collect diagnostics and escalate if needed
Enable verbose logs for Apex LSP, capture error messages, and prepare a reproducible scenario for support. Escalate to a professional if the issue blocks critical work.
Tip: Include timestamps, exact error strings, and environment details.
Diagnosis: VS Code shows an Apex LSP error message or the Apex language server fails to start when opening a Salesforce project.
Possible Causes
- highExtension mismatch or corrupted installation
- highJava not installed or incompatible version
- mediumSFDC CLI misconfiguration or missing Salesforce DX project setup
- lowNetwork restrictions or proxy blocking metadata load
Fixes
- easyRestart VS Code and reload the window
- easyUpdate or reinstall Salesforce extensions and CLI
- easyInstall/verify Java and set JAVA_HOME correctly
- mediumVerify Salesforce DX project setup and re-authenticate
- mediumCheck network/proxy settings and allow Salesforce endpoints
Frequently Asked Questions
What does an Apex LSP error in VS Code typically indicate?
It usually means the Apex language server failed to start or crashed. This is often due to environment issues like missing prerequisites, extension problems, or improper Salesforce DX project setup rather than your Apex code itself.
It usually means the Apex language server failed to start or crashed, often due to environment issues rather than your Apex code.
Do I need Java installed to run Apex LSP?
Yes. Apex LSP relies on a supported Java runtime. Ensure Java is installed, JAVA_HOME is set, and the Java version is compatible with your Salesforce tooling.
Yes, Java is required. Make sure Java is installed and correctly configured.
Can a corrupted Salesforce DX project cause this error?
Absolutely. If the DX project metadata is incomplete or misconfigured, the Apex LSP may fail to load. Try re-authenticating and revalidating the project structure.
Yes, a corrupted DX project can cause the error. Re-authenticate and validate the project.
Is network access important for Apex LSP?
Some LSP functionality requires connection to Salesforce metadata endpoints. If a proxy or firewall blocks access, the LSP can fail to initialize.
Network access matters. Check proxies and firewall settings if metadata can’t be loaded.
How can I tell if the issue is a bug in the language server?
If all standard fixes fail and you can consistently reproduce it on a clean project with the latest tools, it could be a bug. Capture logs and report to support channels.
If fixes fail and you can reproduce on a clean setup, it might be a bug. Collect logs and contact support.
When should I consider professional help?
If the error blocks critical development after exhaustively following recommended steps, seek expert assistance. They can provide an environment-specific analysis and hands-on remediation.
If you’re blocked after trying standard fixes, consider professional help.
Watch Video
Top Takeaways
- Identify whether the issue is environmental or project-specific
- Prioritize fixes by quickest-impact changes (extensions, Java, CLI)
- Use a minimal repro to isolate root causes
- Engage support with a thorough diagnostic bundle