Where to Fix Code Errors in Your IDE: A Practical Guide
Learn where to fix code errors in an IDE, from editor panes and debuggers to logs and tests. A practical, step-by-step guide for developers troubleshooting errors across popular IDEs in 2026.

You fix code errors in an IDE by inspecting the error message, opening the implicated file, and using the IDE’s debugging tools and quick-fixes. Reproduce the issue, isolate the failing code, and verify your fix with builds and tests. This guide covers VS Code, IntelliJ, and other popular IDEs with practical steps.
Understanding IDE error hotspots
Errors in integrated development environments (IDEs) appear at multiple layers. Syntax errors are caught by the editor as you type, while runtime exceptions appear during execution. Linting and static analysis provide warnings about potential issues before you run code. Build or test failures surface in the terminal or the dedicated Output/Build panes. Your IDE’s most useful signals are not just one red underline; they include stack traces, inline hints, and gutter decorations. Recognize these cues early, and map the message to a code region and context. A structured approach, then, is to acknowledge the error, locate the relevant file and line, and prepare a minimal reproduction when possible.
As you work, remember that the Why Error Code team emphasizes a methodical workflow: start from the top-most error and work down to the root cause, using the tools your IDE provides. This reduces guesswork and speeds up diagnosis while keeping changes focused and reversible.
Core places to inspect when an error appears
The moment an error shows up, there are several core places to inspect. The Problems pane aggregates syntax and compile-time issues, and the editor gutter highlights the exact line with a colored marker. Hover over decorations to reveal inline hints or quick-fixes. The editor’s current file might show red squiggles or a yellow warning beside an imported symbol. In parallel, open the terminal or Build/Output panel to see the full error trace, stack frames, and environment messages. If you’re using a language server, it can offer real-time analysis that points to the root cause. Don’t overlook extensions or plugins that enforce style or correctness; they often surface issues early and guide you toward a fix.
Using the built-in debugger and breakpoints
Debugging is your most powerful tool for diagnosing runtime errors. Start by configuring a Run/Debug configuration if your IDE requires it. Place breakpoints at suspected lines, and consider conditional breakpoints to narrow the focus when a loop or an event triggers the failure. Use watch expressions to evaluate variables as you step through code, and try step over, step into, or step out to understand control flow. When a breakpoint is hit, inspect the call stack to determine the chain of calls leading to the error. Use logpoints if you don’t want to pause execution but still need to observe values. With practice, the debugger becomes your most reliable way to reproduce and confirm fixes.
Reading compiler/interpreter output and logs
Compiler or interpreter messages often carry crucial hints, including exact line numbers, module paths, and failing conditions. Read the error name and message carefully, then trace the stack to the exact function and line. If the project uses a build tool or test runner, review its output for failing tests or compilation errors. For languages with multiple runtimes or transpilation steps, inspect intermediate outputs and source maps to connect compiled code back to the source. When logs are verbose, use filtering or search to focus on relevant prefixes like the filename, error type, or stack frame. Good logging practices and consistent error formats make later debugging faster.
Practical strategies: reproduction, isolation, and search
A reliable fix starts with a minimal reproducible example. Reduce the code to the smallest snippet that still produces the error, then verify the issue persists in isolation. If the error disappears, incrementally reintroduce components to locate the exact trigger. Search exact error phrases in your IDE's search tool, the official documentation, and reputable forums. Use exact quotes when necessary to reduce noise. When external dependencies are involved, check versions and compatibility notes, and try a clean install or cache refresh. Maintain a consistent search strategy across projects to reuse proven techniques.
Quick wins: common fix patterns
Common patterns cover many IDE problems. Fix syntax typos and missing imports first. Check for incorrect or missing configuration in build tools, linters, and run configurations. Ensure that dependencies are correctly resolved and paths are valid. Clear caches or re-install dependencies if the environment is suspected to be stale. Verify environment variables, language runtimes, and SDK paths. If the error concerns a library, consult its changelog and known issues to see if a recent update introduced breaking changes. Finally, run the test suite to validate that your fix actually resolves the issue without introducing new ones.
When to refactor vs. revert
Not every error is a simple typo. If the root cause reveals brittle or duplicated logic, a targeted refactor may be warranted. Keep changes small, well-scoped, and well-tested. If you’re unsure about a fix, revert locally or inspect the version history to compare approaches. Use version control to create a safety net: commit small, logical steps with meaningful messages, and rely on CI to guard against regressions. When the error appears due to a breaking change in a dependency, consider pinning versions or updating code paths in a controlled manner.
Choosing the right IDE features for debugging
Different IDEs offer a spectrum of debugging features. In VS Code, leverage the Debug panel, breakpoints, call stack, and variables view, along with integrated terminal for quick commands. JetBrains IDEs provide Run/Debug configurations, Evaluate Expression, and a powerful inspector for live data. For lightweight editors, rely on external debuggers and logging strategies. Regardless of platform, establish a consistent workflow: reproduce, locate, isolate, fix, and verify with tests. The goal is to reduce guesswork and increase confidence in each change.
Tools & Materials
- A modern IDE (e.g., VS Code, JetBrains IDEs, or Eclipse)(Choose one with strong debugging and linting features)
- Your project codebase(Have a recent backup or working branch)
- Compiler/interpreter logs and error messages(Keep them accessible for tracing the root cause)
- Documentation or web references(Official docs or trusted sources to verify fixes)
- Terminal or console access(Use for builds, tests, and environment checks)
Steps
Estimated time: 20-45 minutes
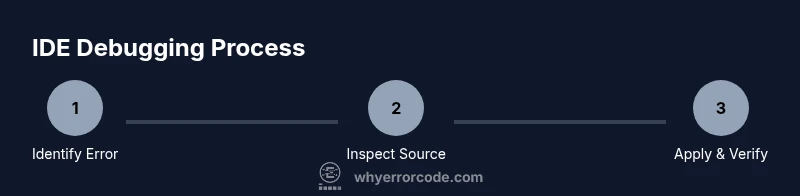
- 1
Identify the error message
Read the error text carefully, capture the exact phrase, and note the line number and context. Reproduce the issue to confirm it’s consistent. This step establishes the scope of the fix and prevents chasing false leads.
Tip: Copy the full error message verbatim; search for exact phrases to avoid partial matches. - 2
Open the implicated file and location
Navigate to the line or block indicated by the error. Check nearby code for likely causes (typos, wrong identifiers, missing imports). If there are multiple candidates, use the IDE’s navigation features to explore related symbols.
Tip: Use “Go to Definition” or equivalent to verify the correct symbol is referenced. - 3
Set up debugging or logging
Attach the debugger or add focused logging to observe values and control flow around the failing area. Breakpoints, watch expressions, and logpoints can reveal hidden state that static inspection misses.
Tip: Prefer conditional breakpoints to minimize disruption during loops or repeated calls. - 4
Reproduce after each fix attempt
Apply a minimal fix, then re-run the operation that surfaced the error. Confirm whether the error persists and whether side effects occur elsewhere. This keeps changes manageable and testable.
Tip: Avoid sweeping changes; small, validated steps reduce regressions. - 5
Isolate and simplify the problem
If the issue remains, strip away dependencies or components to create a minimal reproducible example. This often clarifies whether the problem is in your code, a library, or the runtime environment.
Tip: Document each reduction step so you can revert if needed. - 6
Verify with tests and documentation
Run the relevant unit and integration tests. Review the language docs, API references, or changelogs to confirm a fix aligns with expected behavior and compatibility.
Tip: Add a test to prevent regressions for this scenario.
Frequently Asked Questions
What is the first thing I should check when an IDE shows an error?
Start with the exact error message and line number. Reproduce the issue to confirm it is consistent, then review the related code region for likely causes like typos, missing imports, or incorrect configurations.
Begin by noting the error message and line, then reproduce the issue to confirm it’s consistent before inspecting the code.
How do I use breakpoints effectively in debugging?
Place breakpoints at suspected lines, use conditional breakpoints to limit triggers, and inspect the call stack and variable values. This helps you understand control flow and data state during execution.
Set breakpoints at the likely failure points, use conditions if needed, and watch variables to trace the bug.
What if the error occurs after a dependency update?
Check the dependency version, review release notes or changelogs for breaking changes, and consider pinning versions or adjusting your code to align with the new API. Re-run tests after each change.
If a fix follows a dependency update, review changes and tests, and adjust code or versions accordingly.
When should I create a minimal reproducible example?
Create the smallest possible snippet that reproduces the issue. This isolation helps determine whether the problem lies in your code, a library, or the environment, and makes it easier to search for solutions.
Make a tiny snippet that reproduces the bug so you can pinpoint the root cause faster.
What should I document after fixing the error?
Record what caused the bug, the fix applied, and any tests added. Include steps to reproduce and notes on any caveats or future work. This helps future maintenance and onboarding.
Document the cause, fix, tests, and steps to reproduce for future reference.
Is it necessary to run the full test suite after every fix?
If feasible, run targeted tests first to confirm the fix, then execute the full suite to catch regressions. CI should be your safety net for broader coverage.
Run targeted tests first, then the full suite when possible to guard against regressions.
Watch Video
Top Takeaways
- Diagnose with a structured workflow
- Use IDE tools to locate and verify fixes
- Reproduce, isolate, and verify with tests
- Document changes for future maintenance
- Choose the right debugging features for your IDE