How to Enable Error Highlighting in VS Code
Learn how to enable error highlighting in VS Code with built-in diagnostics, language servers, and extensions. Step-by-step setup, troubleshooting tips, and best practices for a smoother coding experience.

By the end of this guide, you will be able to enable error highlighting in VS Code, identify issues as you type, and quickly navigate to problems. You’ll learn which built-in features to turn on, which extensions to install, and how to tailor diagnostics for your language, project, and preferred workflow.
What is error highlighting in VS Code and why it matters
Error highlighting in VS Code helps you spot mistakes as you type, often underlining syntax errors, type mismatches, and potential runtime issues. This immediate feedback accelerates debugging, reduces context switching, and keeps your focus on resolving the root cause rather than triaging vague errors later. According to Why Error Code, robust error highlighting is a cornerstone of efficient development workflows because it lowers cognitive load and speeds up iteration. In practice, you’ll see colored squiggles for syntax errors, warnings for deprecated patterns, and diagnostic messages in the Problems panel. This real-time feedback is especially valuable when learning a new language, adopting a new framework, or collaborating on large codebases where consistency matters. The goal is to surface actionable information early so you can fix issues before they cascade.
Prerequisites: VS Code setup and language support
Before you enable error highlighting, ensure VS Code is installed and up to date. Check that your target language has a corresponding extension or language server installed, as these provide the core diagnostics VS Code relies on. If you’re working with JavaScript/TypeScript, ESLint or the built-in TypeScript language service can offer enhanced feedback. For Python, the Python extension paired with Pylance or Jedi can improve type checks and runtime hints. Make sure you have a stable internet connection to pull the latest extensions and language servers. Finally, verify your project workspace is properly configured (e.g., a valid package.json for Node projects or a virtual environment for Python) so diagnostics can run against real code rather than placeholder files.
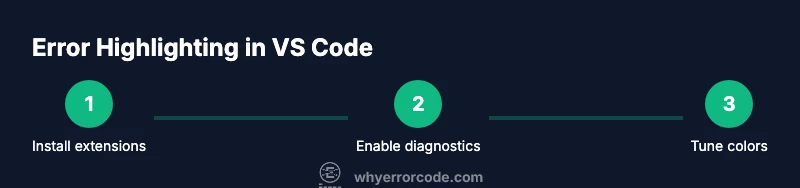
Enabling error highlighting via built-in features
VS Code ships with built-in diagnostic capabilities that cover syntax and some semantic errors. To turn these on, open Settings and search for Diagnostics, then enable the option that highlights problems as you type. You can also customize how diagnostics are presented (underline colors, border styles, and message visibility) to match your preference. If you’re targeting a specific language, ensure its language service is active in the status bar and that the editor is using the correct file association. This section also covers how to toggle error highlighting per workspace and per file type, which is important for polyglot projects where not every file requires the same level of scrutiny.
Using extensions for stronger highlighting
Extensions can extend VS Code’s native diagnostics with richer feedback. ESLint, TSLint (for older projects), Pylance, and language-specific linters provide deeper analysis, catching issues that the core editor might miss. When choosing extensions, prioritize those with active maintenance and clear conflict management. After installing, verify that the extensions’ diagnostic features are enabled in their settings and that they integrate with your language server. Remember that more extensions can mean more background processing, so balance thoroughness with performance.
Configuring settings to control underline styles and colors
Customizing how errors appear can dramatically improve readability. In Settings, search for 'editor. error' formatting options, where you can adjust underline style, thickness, and color. You can map different severities to distinct colors, making errors, warnings, and hints instantly distinguishable. If you prefer a unified theme, ensure your color theme supports diagnostic colors. For JSON users, you can directly edit settings.json to apply global rules or per-language overrides. Suppressing low-priority diagnostics temporarily is also possible, which is useful during high-load development phases where noise reduction matters.
Working with linters and formatters
Linters like ESLint, Flake8, or Pylint and formatters such as Prettier provide proactive checks that compliment the built-in diagnostics. They catch style issues, potential bugs, and anti-patterns that static analysis might not flag. Configure these tools to run on save or on the appropriate events, and ensure their rules align with your project’s style guide. Integrating a coherent linting strategy with VS Code’s problems panel helps you triage issues faster and maintain code quality across teams.
Troubleshooting common issues when highlighting fails
If error highlighting isn’t showing up, start by checking that the language extension is installed and active. Verify that the file type is correctly associated with the language service, and ensure there’s not a conflicting extension disabling diagnostics. Examine the Output and Problems panels for diagnostic messages about the language server. Sometimes a simple reload (Reload Window) or clearing extensions cache resolves the issue. For multi-root workspaces, confirm that each folder has its own configuration where needed. If issues persist, consult the extension’s repository for known conflicts or required settings.
Performance considerations and potential slow-downs
Diagnostics can impact performance, especially on large projects or with memory-heavy language servers. If you notice slowness, consider narrowing the scope of diagnostics (per workspace) or disabling heavyweight extensions temporarily. Use the built-in 'Problems' panel to filter and jump to issues rather than scanning the entire codebase continually. Upgrading to a faster language server, increasing VS Code’s allotted memory, or tuning linting thresholds can reduce lag while preserving helpful feedback.
Best practices and workflows for debugging with VS Code
Adopt a consistent debugging workflow: enable real-time error highlighting, set up a reliable linting strategy, and use the Problems panel to triage issues. Pair keyboard shortcuts with quick commands to navigate between errors, and keep a small, curated set of extensions that enhance your language of choice without creating conflicts. Regularly review and update your settings to reflect evolving project needs, and document any unique diagnostic rules for your team to follow. The goal is to build a predictable, low-friction debugging loop that keeps you productive.
Tools & Materials
- Computer with VS Code installed(Latest stable release recommended)
- Active internet connection(For extensions and updates)
- Recommended extensions list(ESLint, Pylance, TS Language Server, etc.)
- Keyboard shortcuts reference(F1, Ctrl+Shift+P for commands)
- Linting and language packs configured(e.g., ESLint for JS/TS, Pyright for Python)
Steps
Estimated time: 45-60 minutes
- 1
Open VS Code and confirm version
Launch VS Code and verify you are on a supported release. File > Help > About shows the version. This ensures built-in diagnostics and extensions work as expected, laying the groundwork for error highlighting.
Tip: If you’re on an old version, update to access the latest diagnostic features. - 2
Install essential language extensions
Install language-specific extensions (e.g., ESLint for JavaScript, Pyright for Python). These provide deeper error checks and integrate with VS Code’s problems panel for quick navigation.
Tip: Prefer official extensions from the language vendor when possible. - 3
Enable built-in diagnostics
In Settings, enable Diagnostics and ensure the editor flags issues as you type. Validate that the setting applies to the current workspace and file types you work with.
Tip: Use a global setting initially, then tailor per-workspace overrides as needed. - 4
Tune diagnostic colors and underlines
Adjust editor. error underline style, thickness, and color to maximize readability. Choose a color that contrasts well with your theme for quick scanning.
Tip: Test in a sample file with common syntax errors to gauge visibility. - 5
Configure linting on save
Set up your linter to run on save or on type. This ensures you catch issues early without waiting for a manual run, keeping your workflow smooth.
Tip: Balance lint frequency with IDE responsiveness to avoid perceptible slowdowns. - 6
Use the Problems panel for navigation
Open View > Problems to see a list of current diagnostics. Use keyboard shortcuts to jump to each issue and focus your fix.
Tip: Filter by severity to prioritize critical errors first. - 7
Test with deliberate errors
Introduce a few syntax errors in a test file to verify that highlights appear correctly and that navigation to the problem works as expected.
Tip: After testing, revert test changes to your actual project files. - 8
Review and iterate on settings
Periodically review your diagnostic settings and extension updates. Your best workflow evolves with project scope and team standards.
Tip: Document any per-language quirks so teammates can reproduce your setup.
Frequently Asked Questions
What is error highlighting in VS Code?
Error highlighting in VS Code surfaces syntax and diagnostic issues as you type, using underlines and diagnostic messages in the Problems panel. This helps you fix problems earlier in the development cycle.
Error highlighting shows you issues as you type, letting you fix problems faster.
How do I enable error highlighting by default?
Enable built-in diagnostics in Settings and install language extensions that provide language-specific checks. Ensure the language service runs for your file types and that the Problems panel is visible for quick navigation.
Turn on diagnostics in settings and install language extensions for automatic error highlighting.
Which extensions improve error highlighting?
Extensions like ESLint for JavaScript/TypeScript, Pylance for Python, and language-specific linters provide enhanced diagnostics. Choose well-maintained extensions and enable their diagnostic features in settings.
ESLint and Pylance are popular choices, but pick extensions that match your language and workflow.
What if errors don’t show up after enabling?
Check that the correct language server is active, verify file associations, and ensure no conflicting extensions disable diagnostics. Look at the Output and Problems panels for clues, and try reloading the window if needed.
If errors aren’t showing, verify language servers and extensions, then reload the window.
Can I customize how errors are displayed?
Yes. Adjust underline styles, colors, and message visibility in Settings. You can map severities to colors and tailor per-language overrides for precise control.
You can customize colors and underlines to suit your theme and preferences.
Is error highlighting per-language?
Yes. Many language servers offer language-specific diagnostics. Enable or disable diagnostics per language and use language-specific extensions to refine the feedback.
Diagnostics can be enabled per language for targeted feedback.
Watch Video
Top Takeaways
- Enable built-in diagnostics first for quick wins.
- Pair with language-specific extensions for deeper checks.
- Tune visuals to match your theme and improve readability.
- Use the Problems panel to navigate and resolve errors efficiently.