How to Fix the VS Code Debug Stopped Error: A Troubleshooting Guide
A comprehensive, urgent troubleshooting guide from Why Error Code to diagnose and fix the VS Code debug stopped error. Learn how launch.json, breakpoints, extensions, and caches can cause stops and how to resolve them quickly.

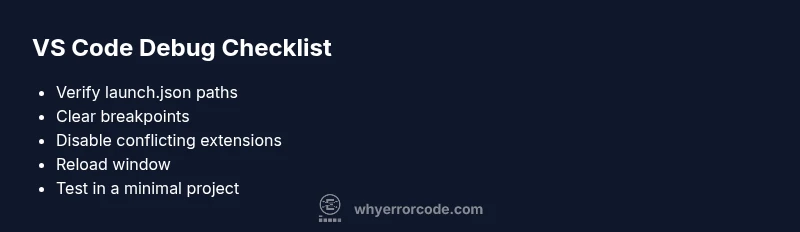
The most likely cause of a vs code debug stopped error is a misconfigured launch.json or a breakpoint/condition that halts execution. Quick fixes include verifying the launch.json configuration, ensuring the correct runtime and program path, clearing all breakpoints, and restarting the debugger. If the problem persists, try disabling conflicting extensions and resetting debugger settings.
Understanding the VS Code Debug Stopped Error
In many development environments, a repairable glitch surfaces as a debugger that suddenly stops in VS Code. According to Why Error Code, the most common root causes are a misconfigured launch.json, stale breakpoints, or a conflicting extension that interrupts the debugging flow. When you see a "debug stopped" message, you should think about whether the debugger is being stopped by a breakpoint, an exception breakpoint, or because the launcher could not start the program correctly. This scenario is not unusual, and the path to a solution often begins with the simplest checks: confirm the launch configuration, restore a clean breakpoint state, and verify the runtime you intend to use. Addressing these basics early can save time and prevent erosion of your debugging momentum.
Quick checks to run before deeper digging
- Open the .vscode/launch.json file and review the top-level properties like type, request, and program. If your project recently moved folders or changed the entry script, adjust the path accordingly. - Ensure the correct runtime (node, python, dotnet, etc.) is selected and that the environment matches your project requirements. - Look for any preLaunchTask that might fail before the debugger attaches, and verify its success independently. - Ensure your workspace is not attempting to attach to a different process or port that is already in use. - If you see a specific error message, use it as a breadcrumb to refine configuration changes rather than making sweeping, global edits.
Steps
Estimated time: 60-90 minutes
- 1
Reproduce and document the issue
Launch the debugging session and note the exact moment it stops, including any error messages in the Debug Console. This helps distinguish between a breakpoint stop and a launch failure.
Tip: Keep a screenshot or log snippet of the stop point for reference. - 2
Check launch.json for accuracy
Open .vscode/launch.json and confirm the correct config entry is selected for your runtime (Node, Python, etc.) and that 'program' points to the right script or entry file.
Tip: If you recently moved folders, fix relative paths and ensure the working directory is correct. - 3
Inspect breakpoints and exceptions
Review all breakpoints, including exception and conditional ones. Temporarily disable all breakpoints to see if the debugger completes execution.
Tip: Remember to re-enable them and test specific conditions one at a time. - 4
Assess extensions and adapters
Disable any extensions that touch debugging or the language server, then restart the editor to check for interference.
Tip: Consider using VS Code's Safe Mode to isolate extension issues. - 5
Reset caches/workspace storage
Clear workspace storage and reload the window. If needed, reset user data for the VS Code instance to a clean state.
Tip: Back up settings before performing resets. - 6
Test with a minimal project
Create a tiny project or a fresh workspace with a simple script and a basic launch.json to confirm the debugger works in a controlled environment.
Tip: If it works in a minimal setup, the issue likely lies in your project configuration. - 7
Consider remote/container scenarios
If debugging inside a container or remote environment, verify container ports, remote attach configurations, and path mappings.
Tip: Verify that the remote workspace matches the local expectations. - 8
Seek expert help if needed
If the stop persists after all checks, escalate to the team or a debugger-adapter maintainer with your config and logs.
Tip: Provide a minimal repro and your environment details to speed up diagnosis.
Diagnosis: Debugger stops immediately after launch or during a step, with no clear crash report
Possible Causes
- highMisconfigured launch.json or incorrect program path
- highStale breakpoints or conditional breakpoints triggering unexpectedly
- mediumExtension conflicts or debugger adapter issues
- lowCorrupted VS Code workspace state or caches
Fixes
- easyOpen and validate launch.json; correct the 'program' path and 'type' for the current project. Save and retry the debug session.
- easyClear all breakpoints, re-run the session, and temporarily disable conditional breakpoints to see if the stop persists.
- easyDisable suspected extensions one by one and restart VS Code to identify any debugger-adapter conflicts.
- mediumReset workspace state or reinstall relevant debugger extensions if issues persist.
Frequently Asked Questions
What does a 'VS Code debug stopped' error typically indicate?
It usually means the debugger halted execution due to breakpoints, an incorrect launch configuration, or a startup issue with the runtime. It can also be caused by extensions interfering with the debugger.
A VS Code debug stopped error usually means the debugger halted because of a breakpoint, a bad launch setup, or a startup issue with the runtime.
How do I fix a misconfigured launch.json?
Open .vscode/launch.json, verify the config type and request, ensure program and cwd are correct, and test with a simple script first. Save and re-run the debug session.
Open launch.json, check type and program paths, validate the working directory, and try a simple script to confirm the configuration.
Should I disable all extensions to troubleshoot?
Disabling extensions can help identify conflicts with the debugger. Disable suspect extensions one at a time, then restart VS Code to test the debugger again.
Yes—try disabling extensions one by one to see if the debugger works, then re-enable them after testing.
What if breakpoints keep triggering unexpectedly?
Review all enabled breakpoints, including conditional ones. Clear or adjust conditions, and test the session with breakpoints turned off.
Check and clear breakpoints, especially conditional ones, then test without breakpoints to isolate the issue.
Can remote or container debugging cause this issue?
Yes. If you are debugging in a container or remotely, verify path mappings, ports, and the remote workspace correlation with your local project.
Remote or container debugging can cause stops if path mappings or ports are misconfigured. Check the remote setup.
When should I escalate for expert help?
If the issue persists after verifying launch.json, breakpoints, and extensions, gather logs and configurations and reach out to an expert or the debugger adapter maintainer.
If it still happens after trying the steps, ask for expert help and share your configs and logs.
Watch Video
Top Takeaways
- Check launch.json first and correct program paths
- Clear and test breakpoints for unexpected stops
- Disable conflicting extensions and adapters
- Reset caches or workspace storage when needed
- If unresolved, reproduce in a minimal setup and escalate