How to Check Error Codes: A Practical, Step-by-Step Guide
Learn how to check error codes across systems, interpret their meaning, and apply fixes with a clear, step-by-step approach. This guide is ideal for developers, IT pros, and everyday users troubleshooting errors.

In this guide you’ll learn how to check error codes across major platforms, interpret their meanings, and validate fixes with a repeatable process. You’ll need access to the system where the error occurred, basic log viewing rights, and a willingness to follow a structured checklist. By following these steps, you’ll diagnose faster and reduce guesswork.
What is an error code and why check it?
An error code is a concise identifier that signals what went wrong, where it happened, and often why. For developers and IT pros, error codes act like breadcrumbs you can follow instead of relying on vague messages. According to Why Error Code, understanding how to check error codes is the foundation of effective troubleshooting. By explicitly capturing the code, you can differentiate between a transient glitch and a reproducible defect, guide user communication, and accelerate escalation when needed. In practice, error codes help you map symptoms to root causes, whether you’re debugging a software component, a device driver, a network service, or a mobile app. The goal is not only to read the code but to extract actionable context from the surrounding log lines and events.
Key takeaway: the code is a starting point, not the final diagnosis; use it to guide deeper investigation and verification.
How error codes are generated and where they live
Error codes arise from many sources: the operating system, runtime environments, libraries, devices, and applications. They are emitted at the point of failure and are typically written to logs, event viewers, or console outputs. In modern systems, codes are often accompanied by human-readable messages, timestamps, and identifiers that indicate module, version, or user context. Knowing where to look—Windows Event Logs, macOS Console, Linux journal, or a mobile crash report—helps you locate the code quickly. The Why Error Code team emphasizes that consistent logging formats and clear code taxonomy make every subsequent investigation faster and more reliable.
Practical tip: establish a habit of capturing the exact code, the component involved, and the steps leading up to the error. These details transform a vague problem into a solvable incident.
Prerequisites and mindset before you start
Before you dive into error codes, ensure you have the necessary access and a plan. Verify you have permissions to view logs, run diagnostic commands, and share findings with teammates or stakeholders. Prepare a simple template to record the code, context, affected users, and reproduction steps. Keep privacy and security in mind; sometimes error messages expose sensitive data. The Why Error Code analysis reminds practitioners to balance visibility with safe practices, especially in production environments. A calm, systematic approach beats frantic, ad hoc attempts every time.
Set expectations: not all error codes have immediate fixes, and some require intermittent monitoring or user follow-up. By setting a plan and documenting assumptions, you reduce back-and-forth and keep the investigation focused.
Collecting context and reproducibility: what to capture before digging
Successful error-code investigations hinge on rich context. Capture the exact error code and message, the affected module or feature, the operating system and version, and the time of the incident. Reproduce the error if possible, and note whether it is reproducible, intermittent, or dependent on user input. Collect surrounding logs or screenshots showing related events (warnings, prior errors, or cascading failures). Gather user reports or telemetry that illustrate the sequence of steps leading to the error. A well-documented context reduces ambiguity and speeds resolution.
Pro-tip: create a one-page incident brief with sections for code, environment, reproduction steps, and observed impact. This becomes a reusable artifact for future investigations and knowledge sharing.
Step-by-step: baseline checks you can perform quickly
Starting with quick checks helps you separate obvious causes from deeper issues. Begin by locating the error code in the user interface, logs, or crash report. Check whether the error appears consistently or only under specific conditions. Review recent changes to the system, such as updates, deployments, or configuration modifications. If you have access, verify that dependencies are present and correctly configured. You’ll often confirm a straightforward misconfiguration or missing resource early in the process.
Document each action and outcome so you can build a reproducible trail. If you’re stuck, pause and prepare to escalate with concise evidence.
Interpreting meanings: mapping codes to likely fixes
Interpreting an error code involves understanding its namespace and pattern. Many codes encode the subsystem (e.g., network, file system, database) and the specific failure type (e.g., timeout, not found, permission denied). Compare the code to vendor or project documentation to identify a recommended fix, a workaround, or a known issue. When documentation is sparse, look for common semantics across platforms with similar codes and rely on error families rather than a single numeric value. This approach reduces misinterpretation and helps you propose corrective actions with confidence.
If you’re unsure, treat the code as a starting point for a targeted search rather than a final answer. Cross-reference the code with recent changes and observed symptoms to narrow possibilities. Always verify the fix on a test environment before rolling it out to production.
Platform-specific workflows: Windows, macOS, Linux, and mobile
Different platforms present error codes in distinct ways. On Windows, you’ll often use Event Viewer or Reliability Monitor to locate codes and correlate them with system components. macOS and Linux expose codes through system logs, dmesg, and journalctl, sometimes beside kernel messages. Mobile platforms (iOS/Android) reveal crash reports and in-app logs that can include stack traces and code identifiers. Create a small, repeatable workflow for each platform: locate the code, gather context, consult official docs, and validate the fix.
The key is consistency: use the same steps, commands, and checks each time you encounter a code. This reduces cognitive load and improves accuracy when comparing incidents.
Common workflow examples: practical scenarios and fixes
Consider a typical workflow when a code appears during startup. First, confirm the exact code and collect environment details. Next, check recent changes: updates, configuration files, or network permissions. If the code refers to a missing resource, verify paths or URLs. If it indicates a timeout, test connectivity and service availability. In database cases, examine connection strings and user permissions. In many cases, the solution is straightforward (permissions, path corrections, or resource availability), but some codes require deeper diagnostics.
While every scenario is unique, documenting the steps and results remains consistent and valuable. Why Error Code analysis shows that most practical resolutions come from verifying environment, dependencies, and configuration, not deep algorithmic fixes. By following a reproducible workflow, you increase the odds of a quick, verifiable resolution.
When codes aren’t enough: red flags and escalation paths
Sometimes error codes point to a deeper, non-obvious issue. If codes recur despite seemingly correct fixes, or if user impact remains high, escalate. Collect precise evidence: time of occurrence, affected users, steps to reproduce, and logs or traces. Engage stakeholders early and use a standardized incident report. In complex environments, consult platform-specific forums or vendor support with a structured summary of the problem. The goal is to convert ambiguity into a clear path to a workaround or permanent fix.
At this stage, you may need to reproduce the problem in a controlled environment, analyze related subsystems, or request additional telemetry. Escalation is a structured, data-driven step—not a failure of your investigation.
Documentation, knowledge sharing, and next steps
Record the error-code incident with clear, repeatable steps and outcomes. Share the incident brief with teammates and update your knowledge base or runbook. Include the code, environment details, reproduction steps, and the final resolution or workaround. Document lessons learned, potential gaps in monitoring, and recommended improvements to prevent recurrence. The aim is to turn a single incident into a learning resource that helps others handle similar codes faster in the future. The Why Error Code Team emphasizes that robust documentation is the backbone of resilient troubleshooting.
Practical takeaways and immediate actions you can implement today
- Capture exact error codes and the surrounding context for every incident.
- Maintain a consistent, platform-specific workflow to locate and interpret codes.
- Differentiate between code meaning and actionable fixes; use the code as a map.
- Document outcomes and share findings to improve team knowledge and future response.
- Treat codes as starting points, not definitive diagnoses; validate fixes and monitor results.
Tools & Materials
- Computer or device with internet access(Windows, macOS, Linux, or mobile OS; admin rights may be needed for logs)
- Access to logs or events viewer(Windows Event Viewer; macOS Console; Linux journalctl; mobile crash reports)
- Terminal or command prompt(PowerShell, Terminal, or shell with appropriate privileges)
- Screen capture or note-taking tool(Screenshots or screen recordings helpful for sharing)
- Documentation or knowledge base(A ready template to capture findings)
Steps
Estimated time: 60-120 minutes
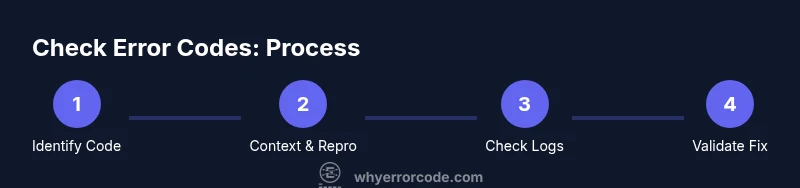
- 1
Identify the error code
Locate the exact code from the error message, UI, log, or crash report. Record the code and the context (time, user, action that triggered it). This step avoids guessing and frames the investigation.
Tip: Take a screenshot or copy-paste the exact text of the error. - 2
Gather context and reproduction steps
Collect environment details: OS version, application or service name, network status, and recent changes. Try to reproduce consistently, noting any different results when conditions change.
Tip: Write down the sequence of steps to reproduce the issue. - 3
Check local logs and events
Open the relevant logs and look for entries that align with the timestamp of the error. Correlate code with adjacent warnings, errors, or stack traces to identify a likely subsystem.
Tip: Filter logs by time range and search for the exact code. - 4
Validate prerequisites and resources
Verify that required resources (files, databases, network access) exist and are accessible. Missing permissions or unavailable resources are common root causes.
Tip: Ensure all dependencies are in expected states before continued testing. - 5
Search official documentation
Consult platform or vendor docs for the exact code. Look for known issues, recommended fixes, or configuration changes related to the code.
Tip: Use exact code string as a search term to avoid false positives. - 6
Test a targeted fix in a safe environment
If you identify a probable cause, apply a controlled change (e.g., adjust permissions, fix a path, restart a service) in a test environment and re-run the steps.
Tip: Avoid making wide changes in production; test first. - 7
Confirm the result and monitor
After applying the fix, re-run the reproduction steps to confirm the error no longer occurs. Monitor for recurrence over a defined window.
Tip: Log the outcome with a timestamp and verify user impact is resolved. - 8
Document the outcome
Record the final resolution, remaining uncertainties, and any follow-up actions. Update runbooks or knowledge bases for future reference.
Tip: Summarize in 1-2 pages with key data points. - 9
Escalate if needed
If the code persists or the fix requires deeper expertise, escalate to the appropriate team with concise evidence and recommended next steps.
Tip: Provide a clear problem statement and evidence pack. - 10
Close the loop with stakeholders
Communicate the resolution and any ongoing monitoring plan to users or teams affected. Gather feedback to improve future handling.
Tip: Share a brief, jargon-free update to keep everyone aligned.
Frequently Asked Questions
What is an error code and how is it different from an error message?
An error code is a concise identifier that signals the subsystem and type of failure, while the error message provides a human-readable description. Codes help you map to a consistent set of fixes across environments.
An error code is a compact identifier used to locate the issue quickly, while the message gives more detail for humans to read.
Where can I find error codes on Windows, macOS, Linux, and mobile platforms?
Windows typically uses Event Viewer, macOS uses Console, Linux relies on journalctl or syslog, and mobile platforms use crash reports or in-app logs. Each platform has its own toolset for locating codes and related details.
On Windows, check Event Viewer; on macOS and Linux, use the system logs; on mobile, review crash reports.
How do I know which part of the system produced the code?
Look for the code’s namespace or module indicator in the log entry, stack trace, or crash report. This helps you map the code to a subsystem such as network, file system, database, or UI. Cross-reference with the code’s prefix or known patterns.
Check the log entry for a module name or stack trace to see which part generated the code.
What if the error code doesn’t have documentation?
If there’s no documentation, search for similar codes in vendor forums, knowledge bases, or community discussions. Compare behavior with codes in related systems and log patterns to infer likely fixes.
If docs aren’t available, look at similar codes and use those patterns to guide your next steps.
Can error codes be unpredictable across platforms or versions?
Yes, codes can vary by platform or software version. Always verify against platform-specific docs and include version information when analyzing codes to avoid misinterpretation.
Codes can differ between platforms and versions, so check the exact context.
Should I involve others when dealing with a difficult error code?
Yes. When codes are complex or impact multiple teams, escalate with a concise evidence package and recommended next steps. Collaboration often leads to faster resolution.
If it’s tricky, don’t go it alone—bring in teammates with the right expertise.
Watch Video
Top Takeaways
- Understand that error codes guide diagnosis, not final fixes
- Always collect context before acting
- Use platform-specific logs to locate codes quickly
- Document and share findings to prevent repeat incidents
- Escalate with evidence when fixes require specialized expertise