Launch JSON Error in VS Code C++: Troubleshooting Guide
A practical, step-by-step guide to diagnose and fix the launch.json error in vs code c++, including a diagnostic flow, hands-on steps, safety tips, and prevention strategies.

The launch json error in vs code c++ is most often caused by a misconfigured launch.json or an incorrect program path. Start by opening .vscode/launch.json, verifying the config name, type (cppdbg or lldb), and the 'program' field points to your compiled executable. If the issue persists, regenerate the configuration with the C/C++ extension or reset debugger settings, then re-run the debugger to confirm.
Why the launch json error in vs code c++ happens
When you work with C++ in VS Code, the debugging experience hinges on a accurately configured launch.json file. The most common cause of a launch json error in vs code c++ is a mismatch between the expected executable path and the actual build output. Other frequent culprits include using the wrong debugger type (cppdbg vs cpptools), incorrect working directory, or accidental edits that removed required fields. Path problems are particularly common on Windows where backslashes, spaces, and quotes can trip up the parser. Always remember that the launch.json configuration encodes how the debugger starts, which program to run, and how inputs are supplied. A small misstep here can stop your entire debugging session before you see a single breakpoint. The Why Error Code team emphasizes validating every field and comparing it against your build output to quickly identify mismatches and avoid repeated failures.
Common symptoms and signals
If you encounter a launch json error in vs code c++ you might see one or more of the following: the debugger console failing to attach, an error message like Cannot Launch or Cannot Find Program, or VS Code reporting that the chosen configuration could not be started. You may also notice that breakpoints are ignored or the terminal launches a shell without running your program. These symptoms typically indicate a path or configuration mismatch, or an incomplete build. In some cases, the error appears only after updating the compiler, changing the workspace, or moving the project folder. Quick wins include confirming the exact path to your executable and ensuring that the active workspace is the one you expect.
How the C/C++ extension interacts with launch.json
The C/C++ extension relies on launch.json to supply critical debugging metadata. The key fields include: name (the configuration label), type (cppdbg for GDB/MI-based debuggers or cppvsdbg on Windows), request (launch or attach), program (absolute path to the executable), miDebuggerPath (optional, path to gdb/lldb), and cwd (the current working directory during debugging). If any of these values are wrong, the debugger may fail to start with a group of errors that point to launch.json. On macOS and Linux, ensure the debugger is compatible with your toolchain and that the terminal doesn’t alter PATH during startup. The extension also reads environment variables defined in the configuration; missing or wrong env vars can cause silent failures or unexpected behavior.
Common misconfig scenarios and how they show up
Misconfigurations typically fall into a few buckets: (1) program points to a non-existent or moved executable; (2) relative paths used in program or cwd when the workspace root changed; (3) wrong debugger type selected for your platform or toolchain; (4) missing preLaunchTask that builds the project before debugging; (5) quoting or escaping issues in Windows paths. Each scenario has a telltale sign: a Cannot Launch error usually means the program path is wrong; a Cannot Attach indicates a mismatch between the process and the debugger type. By systematically checking each field, you can quickly isolate the root cause and restore a smooth debugging session.
Diagnostic flow overview
A clear diagnostic flow helps you go from symptom to solution without getting overwhelmed. Start with the symptom you observe, move to a likely cause based on that symptom, apply the recommended fix, and re-test. If the fix doesn’t resolve the issue, proceed to the next likely cause in a logical order. This approach minimizes back-and-forth editing of launch.json and reduces the risk of breaking other configurations. Remember to document each change so you can revert if needed. Adopting a consistent naming convention for configurations also helps prevent confusion when you work with multiple projects or workspaces.
Prevention and maintenance tips
To prevent future launch.json problems, commit a clean, well-documented launch.json into version control, and keep a small, repeatable template for new C++ projects. Use absolute paths during initial setup and avoid moving build outputs after you configure a working debug session. Regularly rebuild before debugging and consider enabling a preLaunchTask to automate the build step. When collaborating, include launch.json in the project’s .vscode folder so teammates use the same debugging setup. Finally, keep the C/C++ extension updated, as newer versions may require small syntax adjustments or new fields.
When to seek professional help
If you’ve exhausted the standard checks and your launch.json still fails, seek professional help. Complex projects with custom toolchains, cross-compilation targets, or non-standard debuggers may demand deeper analysis of your build system and integration points. A fresh set of eyes can spot subtle issues like environment-specific path resolutions or toolchain incompatibilities that aren’t obvious from error messages alone. The Why Error Code Team recommends documenting every config change and sharing a minimal reproducible example when asking for support.
Quick tips for lasting debugging sanity
- Maintain a minimal reproducible project when testing debugging configurations.
- Regularly back up your .vscode/launch.json before edits.
- Use absolute paths during setup, then prune to relative paths if needed for portability.
Final quick mental model
Think of launch.json as the bridge between your code and the debugger. If the bridge is misaligned—wrong path, wrong debugger type, or missing build step—the debugging session can fail before it starts. With careful validation of each field and a repeatable setup process, you can keep the bridge sturdy and reliable.
Steps
Estimated time: 60-90 minutes
- 1
Open and inspect launch.json
Navigate to .vscode/launch.json and review the top-level fields. Confirm the config name and the debugger type match your setup. Check that the program field points to the built executable.
Tip: Keep a backup before editing; use the C/C++ extension to regenerate if unsure. - 2
Build the project
Trigger a full rebuild so the executable exists at the path referenced in launch.json. Fix any compile errors first, then re-try debugging.
Tip: Add a preLaunchTask to automate this build in the future. - 3
Validate the program path
Copy the exact path from the build output and paste it into the program field. Use absolute paths to avoid workspace-relative confusion.
Tip: Avoid spaces and non-ASCII characters in the path if possible. - 4
Check the cwd and environment
Ensure the cwd is correct for your project structure and that any required environment variables are defined in the launch.json.
Tip: Environment variables can vary between machines; document them. - 5
Regenerate configuration if needed
If the structure changed (new output directory, different executable), use the C/C++ extension to regenerate a clean launch.json.
Tip: Compare with a fresh template to spot missing fields. - 6
Test and iterate
Run the debugger again. If it still fails, test with a minimal sample project to isolate config issues from code issues.
Tip: A minimal repro makes root-cause analysis faster.
Diagnosis: VS Code cannot start the C++ debugging session with an error related to launch.json
Possible Causes
- highIncorrect program path in launch.json
- mediumWrong debugger type selected for the platform
- highBuild output missing or out-of-date
- lowWorking directory (cwd) misconfigured
Fixes
- easyVerify the 'program' path in launch.json points to the compiled executable.
- easyEnsure the correct debugger type (cppdbg or cpptools) for the target platform.
- easyRun a full rebuild so the executable exists and matches the config.
- easyUpdate cwd to the project root or the folder containing the executable, as appropriate.
Frequently Asked Questions
What is launch.json and why does it affect debugging in VS Code for C++?
Launch.json is a debugger configuration file that tells VS Code how to start the debugger for a given project. For C++, it specifies the program to run, the debugger type, and the working directory. A mismatch in these values often causes debugging failures. Keeping this file accurate ensures a smooth debugging experience.
Launch.json tells VS Code how to start debugging C++ code; mismatches here cause crashes or failed launches.
Why does VS Code say it cannot find the program even though the executable exists?
This usually means the program path in launch.json doesn’t point to the compiled executable. Check the exact path, the build output directory, and whether you need to run a build before debugging. Correcting the path or rebuilding often resolves the issue.
The path in launch.json might not point to the right executable; rebuild if needed and fix the path.
How do I regenerate launch.json with the correct settings?
In VS Code, open the Run and Debug pane, select C/C++ (GDB/LLDB) or CPPTools, and let VS Code generate a fresh launch.json. Compare the new file with the old one to identify what changed and ensure it matches your project structure.
Use the C/C++ extension to generate a fresh launch.json, then adapt any project-specific paths.
Should I always rebuild before debugging to avoid launch.json errors?
Yes. A clean build ensures the executable exists where launch.json expects it, reducing the chance of path-related errors. Consider setting a preLaunchTask to automate this step.
Building first helps prevent missing executables during debugging.
What are common misconfigurations in launch.json for C++?
Common issues include incorrect program paths, wrong debugger type, incorrect cwd, and missing preLaunchTask. Even small typos or extra spaces can cause errors. Always validate each field against your project structure.
Most issues come from path or debugger type mistakes.
If launch.json errors persist after edits, what should I do?
Create a minimal repro project to isolate the issue, check extension logs, and consider asking for help with a shareable config snippet. Sometimes the problem lies with toolchain compatibility.
For stubborn cases, share your config and steps with a support forum.
Watch Video
Top Takeaways
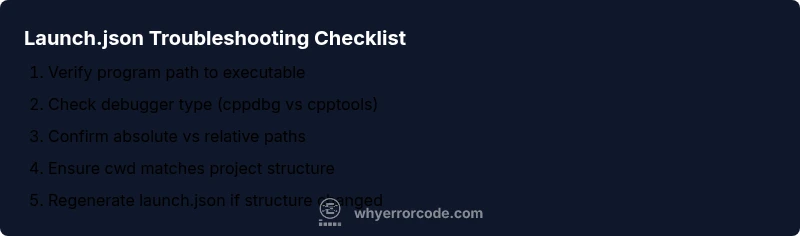
- Back up before edits
- Verify program path precisely
- Regenerate launch.json when project structure changes
- Build before debugging
- Prefer absolute paths during setup